We’ve got some very exciting things brewing for our free Remote Desktop Commander Lite Client, which thousands of network admins use worldwide to manage their Remote Desktop Services deployments both on-premises and in Azure.
However, we’re very excited to share the next step of our solution’s integration with WVD, and encourage you to sign up below to try the beta version that will be available in a few weeks time.
Product Integration With The New WVD PowerShell Management Libraries
As some of you may already know, the current methods of managing WVD are through a set of PowerShell libraries and/or taking the time to deploy Microsoft’s REST API web-based management console. Both approaches have their limitations, and the management features provided in both do not offer feature parity yet with the management features for RDS in the Windows Server Manager.
So, we have started wrapping the WVD Powershell management library in our Remote Desktop Commander management GUI. Management actions in our GUI are passed internally to the PowerShell libraries without the admin needing to use PowerShell at all. Moreover, we are offering two modes of management for Windows Virtual Desktop.
Our new beta version dynamically queries the WVD Broker to get tenant host pools and hostsChoose the management mode you want to use with WVD, based on whether you have installed our tool inside or outside of your Azure VNet.
Full management feature parity is available when you deploy Remote Desktop Commander into the same Azure VNet where your WVD host pools are running.
Windows Virtual Desktop Management External Mode
“External Mode” a.k.a “Outside Mode” provides a more limited set of management functionality based on the current version of the WVD Powershell library, such as logging off and disconnecting users, sending notification messages to users, and taking hosts in and out of drain mode. However, in this mode you can run our tool from any system that has Internet access to access the WVD broker service.
A subset of WVD management features are provided, based on wrapped WVD Powershell management libraries, when Remote Desktop Commander is installed outside the Azure WVD VNet.
Other features in our upcoming beta release include our software’s ability to automatically install the WVD PowerShell Management libraries for you from the PowerShell Gallery, and the convenient caching of administrative credentials used by those PowerShell libraries.
Perhaps most importantly, our Remote Desktop Commander Management client now gives you the power to manage both your traditional on-premises Remote Desktop Services deployments, Remote Desktop Services deployments located in Azure, and new Windows Virtual Desktop deployments all in one interface. It can be instructed to query as many connection brokers or WVD tenants as required for RDS collection and WVD host pool information.
Remote Desktop Commander will automatically prompt you to install the WVD PowerShell Management libraries, and then will do so for you.
Sign Up To Be Notified When The Beta Release Is Available
The RDPSoft Approach to Remote Desktop User Activity Monitoring
Today I’m going to discuss our unique approach to user activity monitoring on the modern network. Most corporate networks these days are hybrid, meaning some employee workstations are hosted in the cloud (e.g. Windows Virtual Desktop, DaaS, Remote Desktop Session Hosts / Citrix XenDesktop Hosts in Azure) and some are hosted on premises (physical desktops, on-premises virtual desktops, and Remote Desktop Session Hosts / Citrix XenDesktop Hosts).
Because of this, we have designed our solution’s architecture to support user activity monitoring in such heterogeneous networks. How so? Let’s dig deeper.
Terminal Server User Activity Monitoring – Soft Audit
In this use case, an organization uses Remote Desktop Session Hosts or Citrix XenDesktop Session Hosts to provide session-based workspaces for its employees. Management simply desires a “soft audit” of routine teleworker activity on a daily and weekly basis to correlate remote work with the hours that employees self-report when working offsite.
In this scenario, our Remote Desktop Commander Suite can be deployed without installing its optional agent service. User session data is collected remotely over the network, and aggregated into user time tracking reports like so:
You can monitor Terminal Server User Activity in a detailed fashion…
Or you can monitor Terminal Server Users at a higher, executive level.
Remote Desktop User Activity Monitoring – Hard Audit
Of course, for more highly regulated industries, or special HR scenarios, more intensive user activity monitoring may be warranted. In this case, the Remote Desktop Reporter agent can be deployed on all Remote Desktop Session Hosts, Citrix XenDesktop Session Hosts, or Windows Virtual Desktop hosts, and Group Policy can be employed to launch a special in-session process that does periodic screen captures, as well as capture detailed information regarding program window captions and websites visited, inbound/outbound UDP/TCP activity, and program use, as shown below:
During a hard audit of user activity, administrators can step through screen captures
When stepping through a full session recording, administrators can review all network connections and program window captions during the session.
Administrators can also review what programs were running at given times in the user session.
In order to find recorded sessions with specific activity, Remote Desktop Commander provides a search tool that can query by window title, port use, or program use.
Live RDP Session Monitoring
In some cases, managers may need the ability to do “live” or “spot check” RDP session monitoring of multiple user sessions from different terminal servers, Windows Virtual Desktops, or on-premises physical workstations all at once. Fortunately, the newer shadowing and remote assistance architecture in Windows Server 2012, Server 2016, Server 2019, and Windows 10 makes this possible. With a few clicks, a manager can keep an eye on multiple user sessions at once, no matter the system they are connected to, and zoom in/out to observe user activity tacitly in the background.
View and Monitor Multiple RDP Sessions At Once With the MiniView Dock
Virtual Desktop User Activity Monitoring
Of course, all of the above scenarios can be replicated if you also need to monitor virtual desktops or physical workstations. The Remote Desktop Commander agent can be deployed in the exact same manner, and once it has been so deployed, you can conduct both soft audits and hard audits of user activity in these environments as well, including the recently announced Windows Virtual Desktop platform in Azure.
Over the past 6 years, I have had the privilege of talking to server based computing admins worldwide, discovering the key pain points they must overcome when taking care of their day-to-day management tasks, especially if they manage Remote Desktop Services deployments.
Perhaps unsurprisingly, the loss of TSAdmin featured prominently in these discussions. But, more on that in a moment.
The result of these discussions? Remote Desktop Commander. This next step in the evolution of our Remote Desktop Services solution set was developed in direct response to the specific pain points I heard articulated time and time again by RDS admins.
No More TSAdmin in Windows Server 2012
Without a doubt, one of the biggest issues Windows server admins have been dealing with as they migrate from Server 2008 RDS deployments to RDS on Server 2012, 2016, and 2019 is the lack of a simple and powerful RDP management tool. Specifically, a tool that handles some of the most common terminal server user session and process management tasks they need to perform on terminal servers and session hosts in their RDS collections. This issue first came to light with the release of Windows Server 2012, as the former TSAdmin (Remote Desktop Services Manager) utility was orphaned by Microsoft. Terminal Server session management tasks were, in the opinion of many, very poorly integrated into the Remote Desktop Services Manager (RDSM) in the Server Manager program. Moreover, if your RDS collections are more than a few dozen session hosts in size, the Remote Desktop Services Manager can hang and simply will not scale properly.
Managing Server 2012 User Sessions with Remote Desktop Commander
With many admins still not comfortable using PowerShell scripting to do Remote Desktop Services management tasks, the situation has become untenable.
As a result, some admins turned to our free Remote Desktop Admin Toolkit, which was a collection of basic tools that could do limited user session and process management tasks. However, none of these tools were integrated with each other, and their feature set was rather limited.
A Free TSAdmin Replacement for Remote Desktop Services Deployments
As a result, we built an integrated, easy-to-use, and powerful terminal server management utility: Remote Desktop Commander Lite.
Viewing Process Memory Consumption by User on Server 2012
The Remote Desktop Services Manager features for Windows Server 2012/2016/2019 that ship with RDPSoft’s Remote Desktop Commander are too numerous to list. Therefore, rather than us “bullet point” you to death, take a look at our video introduction to Remote Desktop Commander on YouTube demonstrating the intuitiveness and power of this utility.
One of the most interesting things you will see in this video is how Remote Desktop Commander can intelligently group related fields, in order to show you things like total memory consumed by user, by server, or RDP bandwidth, for instance. There are also features we provide that were never present in TSAdmin, such as the ability to review RDP latency and connection quality for multiple user sessions at once.
Which Edition of Remote Desktop Commander Do You Need?
Because we know that all of our customers may not need a comprehensive monitoring and reporting solution for their RDS/Citrix farms at this time, we now offer three different classes of license:
Viewing Server 2012 session process memory consumption, grouped by heaviest memory consumers.
Remote Desktop Commander Lite – completely free for all RDS, WVD and Citrix farm admins – and it provides you with the ‘TSAdmin like’ session management features you need for day-to-day administration of your Remote Desktop Services and Citrix server farms.
Premium Management Features for Remote Desktop Commander Lite – adds a powerful feature superset to Remote Desktop Commander, and overcomes some of the shortcomings in Microsoft’s shadowing technology, giving you a very powerful RMM tool designed specifically for support Remote Desktop user sessions and Remote App sessions. Additionally, it allows you to delegate specific RDS management tasks to help desk staff across your RDS collections without making them admins, which is not available in Microsoft’s Remote Desktop Services Manager. Best of all, it only costs $99.99 per help desk technician or admin per year, which is much less expensive than typical RMM tools.
Remote Desktop Commander Suite – which only costs $9.99 per monitored RDS, WVD, or Citrix host per month – gives you TSAdmin replacement management capabilities outlined above, but also includes:
Our Remote Desktop Reporter utility for historical session user activity, RDS, WVD, and Citrix performance monitoring and reporting, license reporting, connection quality/RDP latency reporting, RDP security (login and login failure) tracking, and session recording
SPL Tracker, which helps MSPs and others automate the chore of Microsoft SPLA and Citrix CSP license reporting
Greetings faithful RDPSoft customers, friends, and blog readers! We’re excited to announce the impending arrival of our newest product – Remote Desktop Canary. We’ll be starting our beta testing program soon, so we’d love for you to sign up below to participate.
What’s Remote Desktop Canary, you may ask?
It’s our brand new Synthetic RDP Monitoring solution for Remote Desktop Services deployments. One of the most challenging aspects of monitoring the health of your Remote Desktop Services environment is measuring how quickly it responds to external and internal logins.
For instance, your Network Monitoring Solution may indicate that everything is working fine – your Connection Broker is up and running, your Remote Desktop Gateway services are operational, etc, but then users start to call in and complain about slow connection times, connections failing, etc.
The only real way to stay on top of this is to leverage what is known as Synthetic RDP Login Monitoring, whereby a full RDP connection using an RDP client is made into your environment, while various metrics are being measured on the client side. In other words, it’s a set of recurring tests you can configure to alert you when inbound RDP connections to your environment fail or take longer than normal to connect.
Until now, this sort of monitoring / RDP login testing has only been provided by a few vendors in the market – at an extremely high price. So, just like we did with our Remote Desktop Commander Suite, we’re bringing this technology into the market as an extremely affordable monthly or annual subscription. It will be available for purchase as a self-hosted solution or as a solution we host for you securely in the Cloud, whatever your preference may be.
What are you waiting for? If you want to check it out, fill out the form below to sign up for our beta program. Once you sign up, you’ll be notified when the next beta build is ready to download, install, and test. As a token of our appreciation, all of our beta testers will be provided with special discounts if they wish to purchase a subscription when Remote Desktop Canary is released in Q4 of 2019.
// Update the count down every 1 second
var x = setInterval(function() {
// Get today's date and time
var now = new Date().getTime();
// Find the distance between now and the count down date
var distance = countDownDate - now;
// Time calculations for days, hours, minutes and seconds
var days = Math.floor(distance / (1000 * 60 * 60 * 24));
var hours = Math.floor((distance % (1000 * 60 * 60 * 24)) / (1000 * 60 * 60));
var minutes = Math.floor((distance % (1000 * 60 * 60)) / (1000 * 60));
var seconds = Math.floor((distance % (1000 * 60)) / 1000);
// Output the result in an element with id="demo"
document.getElementById("demo").innerHTML = days + "d " + hours + "h "
+ minutes + "m " + seconds + "s ";
// If the count down is over, write some text
if (distance < 0) {
clearInterval(x);
document.getElementById("demo").innerHTML = "EXPIRED";
}
}, 1000);
New Features Include: – Direct Querying of the WVD Broker For Automatic Host Pool and Host Listing –Internal (Azure VNet) and External (Outside Azure) Management Options –Live Profiling of User Experience With the New User Input Delay Counter
Hello everyone! Andy here with some exciting news. Actually, lots of exciting news. First: Microsoft just made us an Official Windows Virtual Desktop Partner! We’re thrilled to be a part of the WVD rocket ship ride and cannot wait to drive innovation related to monitoring and managing this new app and desktop hosting platform; so please read on…
Secondly, we now have a Preview Release available of our free Remote Desktop Commander Lite Version 4.8, which has some special new features that make managing Windows Virtual Desktop a lot easier. I’ve listed those below, so read through them, keep scrolling to watch a demonstration video and then follow the link to request your download. And by all means, start support tickets with us to request new features and report any bugs.
Windows Virtual Desktop Broker Integration Now Available
Manage Windows Virtual Desktop Hosts Just Like Your On-Premises Remote Desktop Services Environment With Remote Desktop Commander Lite
In previous versions of Remote Desktop Commander, if you wanted to manage WVD hosts, you had to create a Computer Group first and then import your hosts from your Active Directory domain. No longer – now you only need to launch a simple dialog, enter in your tenant name and WVD admin credentials, and choose the WVD Management Mode (Internal/External) you want to use. Remote Desktop Commander will then dynamically query the WVD brokers to auto-generate all your host pools and associated hosts in the left hand tree view for you! But wait, there’s more:
Dual WVD Management Modes – Internal and External
Choose the Management Mode You Want Use With WVD, Based on Whether You Have Installed Our Solution Inside or Outside of Azure.
When you set up a link to the WVD Broker above, you specify whether or not you want Remote Desktop Commander Lite to operate in Internal or External WVD Management Mode.
External Modegives you a less-feature rich WVD management experience, but does not require Remote Desktop Commander Lite to be deployed inside the Azure VNet with your hosts. You can install it on your own local computer, and still do basic session management tasks like logging off, disconnecting, and messaging users.
Get A Handle On User Experience By Monitoring the New User Input Delay Counters Live on Multiple User Sessions at Once
Profile User Experience in RDS and WVD With the User Input Delay Counter
In Windows Server 2019 and Windows 10, Microsoft introduced the new User Input Delay counter. Fundamentally, this performance counter tells you how long user input (e.g. keyboard clicks and mouse clicks) sits in the input queue on a RDS or WVD host, until it is received for processing by an application’s message queue. Latency may look fine, but if User Input Delay starts increasing because a WVD host is under load, that could be a sign that user experience is degrading to the point where you want to add more hosts or increase the VM instance size of your hosts.
WVD Management Demonstration Video and Download Link
Excited? I thought you might be. For more information on all the above, including a tutorial on how to set up this preview release of Remote Desktop Commander Lite in your WVD environment, please watch the following video, and then click the link below to request download instructions.
Greetings friends and current Remote Desktop Commander customers! We’ve just released Version 4.8 of the Remote Desktop Commander Suite. This new version offers:
additional features for Windows Virtual Desktop management and monitoring;
the ability to both live monitor and report on the new User Input Delay counter found on Windows Server 2019 and Windows 10;
and numerous other product enhancements;
We’re also excited to announce a new promotion for WVD deployments and for customers who want to purchase multiple products before the end of this year!
New Windows Virtual Desktop Features Now Available in Version 4.8:
–Direct Querying of the WVD Broker To Import and Automatically List Hosts and Host Pools –Internal (Within Azure VNet) and External (Outside Azure) Management Options –Delegation of Administration For Your WVD Support Technicians
Import Hosts and Host Pools Automatically Inside Remote Desktop Commander Using the WVD Broker
Manage Windows Virtual Desktop hosts just like your on-premises Remote Desktop Services environment with Remote Desktop Commander Lite
In previous versions of Remote Desktop Commander, if you wanted to manage WVD hosts, you had to create a Computer Group first and then import your hosts from your Active Directory domain. No longer – now you only need to launch a simple dialog, enter in your tenant name and WVD admin credentials, and choose the WVD Management Mode (Internal/External) you want to use. Remote Desktop Commander will then dynamically query the WVD brokers to auto-generate all your host pools and associated hosts in the left hand tree view for you! But wait, there’s more:
Dual WVD Management Modes – Internal and External
Choose the management mode you want to use with WVD, based on whether you have installed our solution inside or outside of Azure.
When you set up a link to the WVD Broker above, you specify whether or not you want Remote Desktop Commander Lite to operate in Internal or External WVD Management Mode.
External Modegives you a less-feature rich WVD management experience, but does not require Remote Desktop Commander Lite to be deployed inside the Azure VNet with your hosts. You can install it on your own local computer, and still do basic session management tasks like logging off, disconnecting, and messaging users.
Similarly, you can import your hosts from host pools directly into the Remote Desktop Commander Suite’s Add/Manage Servers area, which makes adding in your WVD session hosts for monitoring a snap.
Import hosts for monitoring directly from the Windows Virtual Desktop Broker URL in the Remote Desktop Commander Suite
Delegate Out Windows Virtual Desktop Management Tasks To Support Desk Staff Using the New WVD Management Delegation Wizard in our Premium Management Features Solution
In Version 4.8, we’ve expanded our Premium Management Features solution to include a delegation of administration wizard for WVD. Now you can delegate rights – including shadowing – to support team members who need to manage your WVD deployment. Yes, that’s right, with our Premium Management Features tool, you can shadow Windows Virtual Desktop sessions without difficulty, and you can limit what your support desk technicians can do on your WVD hosts! All of this functionality only costs $99.99 USD per named admin/help desk user per year, so sign up today!
The WVD Management Delegation Wizard allows you to unify management permissions across all hosts in your WVD host pools, plus allows you to assign specific WVD access rights like “RDS Reader” and “RDS Contributor” to one or more users. It also allows you to set shadowing policies on each host.
Clone WVD management permissions across WVD hosts and host pools. Assign specific rights to users in the WVD tenant.Select the WVD hosts and host pools you wish to unify management permissions on.
Get A Handle On User Experience By Monitoring the New User Input Delay Counters Live or Historically on Server 2019 and Windows 10 RDS and WVD User Sessions
Profile user experience in RDS and WVD with the User Input Delay counter
In Windows Server 2019 and Windows 10, Microsoft introduced the new User Input Delay counter. This performance counter tells you how long user input (e.g. keyboard clicks and mouse clicks) sits in the input queue on a RDS or WVD host, until it is received for processing by an application’s message queue. Latency may look fine, but if User Input Delay starts increasing because a session host is under load, that could be a sign that user experience is degrading to the point where you want to add more hosts or increase the VM instance size of your hosts.
You can now profile User Input Delay in real time using our free Remote Desktop Commander Lite client, and if you are a Remote Desktop Commander Suite customer, Version 4.8 includes two new “User Experience” reports that show you how User Input Delay looked over time in their sessions. Remember, in order to use this counter, your RDS or WVD hosts must be running Windows Server 2019 or Windows 10.
Use the Remote Desktop Commander Suite to determine the average User Input Delay for each user across all of their RDS or WVD sessions.Zoom in to see how User Input Delay fluctuated in each individual RDS or WVD user session.
Other Product Enhancements in Version 4.8
Version 4.8 of the Remote Desktop Commander Suite has several other product enhancements and fixes, namely:
We restored the actual client build number to the live session view in the Remote Desktop Session Navigator and in our Client Software Version reports. This makes it easier to ascertain the precise client levels each user is running.
In some cases, the counters that keep track of actual RDP bandwidth transfer cannot be queried properly on Windows Server 2012 and later operating systems. Version 4.8 of the Remote Desktop Commander Suite has a new, more reliable method of tracking RDP bandwidth for the included RDP bandwidth reports.
We fixed an issue related to reading performance counters on WVD hosts due to a recent Microsoft WVD agent update that was pushed out to WVD hosts in the last few weeks.
Take a Free Trial of Our New RDS Synthetic Monitoring Tool, Remote Desktop Canary
If you haven’t already heard, we launched a brand new product in November called Remote Desktop Canary. It’s a powerful RDS synthetic monitoring tool that performs recurring logins into your RDS environments, notifying you immediately if it cannot logon or if a logon process takes too long. It can record screenshots too of the login sequence so you can troubleshoot login script behavior.
Take Advantage of these Special End Of Year Offers
30% OFF NEW WVD DEPLOYMENTS OF OUR REMOTE DESKTOP COMMANDER SUITE
Want to deploy our Remote Desktop Commander Suite to monitor and manage your WVD infrastructure? If you sign up for a monthly or annual subscription of the Remote Desktop Commander Suite AND book our White Glove Installation Service by December 31st, 2019, we’ll give you 30% off of your subscription pricing for the first 6 months!* That’s a lot of savings you can apply to Azure SQL database subscription costs, and you’ll be guaranteed a pristine, optimized installation in your WVD environment. Click here to request a quote, and in the comments section, type 30OFFWVD.
*Please note that this offer only applies to new Remote Desktop Commander Suite customers deploying our software into WVD in Azure.*
BUY MORE THAN ONE RDPSOFT PRODUCT, AND GET BUNDLED DISCOUNTS
Greetings friends and current customers! We’ve just released Version 2.0 of Remote Desktop Canary. This new version offers:
OCR scanning of RDP login sequence screenshots, so you can be alerted to error conditions after login and/or to slow application startup times;
the ability to do a RDP connectivity test on a group of servers in Active Directory, or a group of session hosts participating in an RDS collection;
the ability to bypass login banners on your servers with synthetic input, so you can profile application load times after the login sequence;
a new helper program called Remote Desktop Canary Kickstarter, that will babysit your Remote Desktop Canary testing session, and automatically restart Remote Desktop Canary in a user session on a VM if the server is rebooted or the testing module is stopped for any reason;
the ability to suspend workflow testing momentarily when servers are down for patching or maintenance;
and much more!
We’re also excited to announce the imminent release of our CEO Andy Milford’s new book on Remote Desktop Security! Read on for a signup link below.
New Features Now Available in Remote Desktop Canary v2.0:
Use OCR Event Detection To Alert To Error Conditions And Slow Application Load Times During Synthetic RDS Logins
Based on your wonderful feedback, we have engineered an OCR event detection engine, that scans screenshots during and after the RDP login sequence. This new engine allows you to define and receive alerts when certain error messages appear on screen, and define and receive alerts if it takes too long for a program to start in a RDP session (e.g. due to profile problems, for instance).
Version 2.0 of Remote Desktop Canary offers a full OCR engine that can alert based on on-screen error conditions OR slow application startup times.
RDP Connectivity Testing On Multiple Computers at Once
Version 2.0 of Remote Desktop Canary now offers a “multi-server testing workflow,” whereby it will quickly check RDP responsiveness on a group of servers in Active Directory, or the servers participating in a RDS collection.
Remote Desktop Canary can perform a routine RDP connectivity check on multiple servers at once.
Bypass Windows Server Login Notification Banners
If your organization uses login notification banners to provide an acceptable use policy (AUP) or warning that users must acknowledge before signing on, Remote Desktop Canary can now bypass this easily with synthetic input. As a result, you can now test conditions beyond the login screen using Canary’s new OCR event detection engine.
Version 2.0 can bypass login notification banners with synthetic input, allowing application and desktop startup times to be profiled with OCR-based alerting.
Keep Remote Desktop Canary Up And Running 24/7 With the New Remote Desktop Canary Kickstarter Applet
Remote Desktop Canary Kickstarter is a companion utility that ships with Remote Desktop Canary v2.0. It “babysits” the actively running Remote Desktop Canary tests – by itself running on a different VM from the VM running Remote Desktop Canary.
As a result, it is able to make sure that Remote Desktop Canary tests stay running at all times, and function properly, even in scenarios like:
1.) When the Remote Desktop Canary system is rebooted, such as for routine maintenance or patch installation
2.) If the Remote Desktop Canary Logon Testing Module stops running for any reason
3.) When an active Remote Desktop connection to the Remote Desktop Canary system is interrupted, resulting in a disconnected session that would prevent synthetic input from properly bypassing login banners
The Remote Desktop Canary Kickstarter applet keeps a watchful eye on the VM running your Remote Desktop Canary workflows.
Toggle Workflows In and Out of Maintenance Mode
While Remote Desktop Canary is running continuous synthetic RDS login tests, you can now toggle specific workflows in and out of maintenance mode with a single mouse click. When placed in maintenance mode, Remote Desktop Canary will suspend testing against that RDS collection or group of servers. This prevents alerts from being generated when you take server(s) offline for patching or other maintenance.
Right mouse click on any workflow to take it in or out of maintenance mode.
Don’t Let Your Remote Desktop Services Environment Get Pwned! Sign Up To Be Notified When Andy Milford’s New Book On Remote Desktop Security Is Released.
Seldom does a week go by these days without a breaking news report on a ransomware attack, the compromise of a large customer database, or theft of trade secrets. What’s the common attack vector that is often used to break into these organizations’ computers? RDP!
Our CEO Andy Milford has been hard at work for over a year, researching and writing a comprehensive book on how to secure your Remote Desktop Services environments. He shows you step-by-step how hackers and Advanced Persistent Threat (APT) actors locate your RDP servers and RDS deployments, how they break in, what they do when they break in, and how to defend against their techniques.
Click here to purchase the Amazon Kindle edition for only $9.99 USD
Given how many of you are standing up new Remote Desktop Services deployments or expanding existing ones right now to facilitate teleworking during the COVID-19 outbreak, it’s imperative that you get serious about RDS security. Hackers and APT (Advanced Persistent Threat) teams know that businesses around the world are “opening up their doors wide” to facilitate remote working at the moment, and they may come knocking at yours soon. Don’t unwittingly let them in.
My book first walks you through how attackers find your RDS deployments, using normal search engines and device fingerprinting search engines like Shodan. Then I show you the tools hackers use to break into your environment, by performing dictionary attacks, man-in-the-middle compromises, or client-side credential stealing. Next, I illustrate some of the most common techniques and scripts they will use to escalate their privileges from a lowly standard user all the way up to local admin and domain admin, and how they are able to deploy and run these scripts and malware on your servers. Finally, I discuss the major types of defenses you can deploy to reduce the likelihood of being attacked, and how to mitigate the damage if you are.
As a way of saying thanks to all users of RDPSoft software who wish to purchase this book, we’ve crafted a special promotion. All individuals and companies that purchase a copy of my new book – just $9.99 on Amazon Kindle – through the end of April 2020 are also entitled to 1 server license of our Remote Desktop Commander Suite software for a month. What can you do with a license of our Remote Desktop Commander Suite for a month? Here are a few ideas:
All you need to do to claim your 1 server, 1 month Remote Desktop Commander Suite license is to email inquiries [at] rdpsoft [dot] com with a screenshot of your Amazon Kindle purchase receipt.
Greetings friends and current Remote Desktop Commander customers! We’ve just released Version 4.9 of the Remote Desktop Commander Suite and our Premium Management Features overlay. This new version offers:
brand new reports that track things like RDP loss and retransmission rates, hourly load on servers, user reconnection attempts through a Remote Desktop Gateway, and much more;
an overhaul of our existing reporting, with a focus on better chart presentation and automatic chart data aggregation in larger environments;
the ability to delegate out management tasks and shadowing to Citrix help desk staff members, allowing them a much more streamlined shadowing experience that does not require the use of Citrix Director or Microsoft Remote Assistance;
numerous other product enhancements.
We’re also excited to announce that we’re expanding an existing promotion which you won’t want to miss, so please read on!
Quickly spot the client users with the highest rates of UDP packet loss
Now that *almost all* of the Remote Desktop Services deployments running Server 2008 R2 have been retired, it remains important to keep an eye on aspects of how the modern Remote Desktop Protocol is functioning in your Server 2012, 2016, and 2019 environments. A key part of that is detecting packet loss and retransmission rates over the UDP channel used by RDS. Version 4.9 of the Remote Desktop Commander Suite now offers two new reports (a detailed variant and a summary variant) that quickly show you which users are suffering the highest rates of packet loss and retransmission. Coupled with other network quality reports like latency, you can quickly spot clients with less reliable connections.
Performance – Hourly Load By Server
Even without our agent installed, you can get daily reports showing how CPU, memory usage, and session counts increased and decreased during certain hours of the day.
Long time users of our Remote Desktop Commander Suite are well familiar with our Historical and Performance Across the Load dashboard. Now this same data is available in report form, either on-demand when working inside this dashboard, or as a report that can be scheduled on a recurring basis. For organizations running RDS, Citrix, and WVD deployments in a public cloud like Azure or AWS, having this information is critical, as it makes sure you’re not wasting your compute dollar as server load waxes and wanes throughout different days of the week.
Remote Desktop Gateway Reconnection Attempts
Similar to its sister report, Session Reconnect Attempts, the new Gateway Reconnect Attempts highlights users that have reconnected through a Remote Desktop Gateway more than 2 times in any hour. This may be indicative of connection issues on their part or, if many users are reconnecting frequently in the same hour, it may be highlighting a load issue on the Gateway or a general misconfiguration in the broader RDS deployment.
Existing Report Improvements
During the Version 4.9 development cycle, we spent a great deal of effort cleaning up the 100 reports in the Remote Desktop Commander Suite, specifically reports that utilize charts.
In previous versions of the Remote Desktop Commander Suite, certain charts could be become unreadable if the volume of data (e.g. the number of user accounts) was too large. While this was easily remedied by pairing the reports with filters that restricted data by computer name, Active Directory group, or user account, we have now added automatic “Top X” and “Bottom X” aggregation to some of the reports. If you have a larger environment with many different users, the charts will automatically show you the outliers (e.g. the Top 15 users with the highest average RDP latency for instance). For example:
“Top X” style aggregation now allows you to spot outliers and makes reports cleaner in larger environments. Here you can see the users with the highest and lowest productivity.
All of this aggregation is automatic so, after you upgrade to Version 4.9, you’ll start seeing it automatically in most of the reports that you typically run on a scheduled basis.
Delegation of Management AND SuperShadow Functionality Now Supported For Citrix Deployments
We’ve heard more recently from many Citrix admins that attempting to delegate out specific management tasks like logging off users, disconnecting users, and shadowing users to help desk and other non-admin staff is painful at best. In some cases, being able to assign that level of granularity via Custom Roles in Citrix Studio is unavailable unless you are an Enterprise customer.
Then, there are issues with shadowing in Citrix Director itself. Currently, shadowing in Director leverages Remote Assistance, which must be installed and configured correctly on the administrator’s system to work correctly. It also informs the target Citrix user of the shadowing attempt. In some industries, the ability to monitor one or more worker sessions for spot auditing and compliance without user notification is required.
Fortunately, our Premium Management Features overlay now solves this big gap for all Citrix deployments, regardless of licensing level. Specific groups of help desk users can quickly be delegated specific management tasks, without being made admins on the host servers. Also, shadowing can be configured with or without consent required. More importantly – it just works. SuperShadow launches and can monitor and manage multiple user sessions at once from different Citrix hosts, whether they are desktop or app sessions, and whether or not the client is using multiple monitors. It all works natively, and is not dependent on Remote Assistance at all.
In three quick steps, you can unify and delegate Citrix management permissions to your help desk staff and other non-admin managers Select (check) the Citrix sessions from the Virtual Apps and Desktops host servers, and then shadowing is just another mouse click away. No dependencies on Remote Assistance required.
Other Product Enhancements
Here are two other product enhancements in Version 4.9:
Loading speed has been improved in the Performance and Load Across the Farm Dashboard, especially for larger environments.
A “Test Email” button has been added in the Remote Desktop Commander Configuration tool, to quickly verify whether or not scheduled reports can relay properly.
We now support the usage of a Service Principal Name (SPN) to authenticate against and manage WVD deployments.
Expanded Promotion – Buy Andy’s RDS Security Book and Get A Month of Monitoring For Free!
Andy’s new RDPwned book on Securing Remote Desktop Services was a hit at launch, with lots of readers sharing their positive feedback with him. When the book launched, we started a promotion whereby any person who purchased the book could pick up a single server’s worth of RDS monitoring via the Remote Desktop Commander Suite for a full month. Now, we’re pleased to extend this promotion further.
If you purchase RDPwned between now and July 31st, 2020, we’ll give you a one month, single server monitoring license of the Remote Desktop Commander Suite, AND a single workflow license of Remote Desktop Canary, so you can get alerted if any problems whatsoever start to develop in one of your RDS collections. That’s a $70 USD value for only $9.99!!
All you need to do to claim your 1 server, 1 month Remote Desktop Commander Suite license and your 1 workflow, 1 month Remote Desktop Canary License is to email inquiries [at] rdpsoft [dot] com with a screenshot of your Amazon Kindle purchase receipt. We’ll take care of the rest!
Remote Desktop Commander 4.9 Upgrade, Purchase, and Demo Links
While most of our customer base runs Microsoft Remote Desktop Services and Windows Virtual Desktop, we have a substantial subset of customers who use our tools to manage their Citrix environments. Most of our Citrix customers use our Remote Desktop Commander Suite solution to gain valuable insights about Citrix host performance and user activity monitoring, without spending lots of extra money on higher Citrix licensing tiers, and/or the Citrix Analytics service. When you consider that our Remote Desktop Commander Suite solution often runs less than $0.70 per user per month to implement, it is a “no brainer” in terms of cost savings.
Over the past year, we’ve gotten lots of great feedback from our RDS and WVD customers who have adopted our Premium Management Features overlay to provide delegation of administration to help desk staff, as well as offer improved shadowing, remote assistance, and live monitoring capabilities to admins, support staff, and managers. During this time, we heard from some of our Citrix customers that needed these same sorts of capabilities.
Citrix Shadowing Limitations
The first question we pondered was “why are Citrix customers asking us for this?” Citrix touts its solution as an extremely robust end user computing platform that greatly exceeds what comes out of the box with RDS or WVD. And certainly shadowing and delegation of administration is something that is provided by Citrix Virtual Apps and Desktops as well as their cloud-based offerings.
Well, we talked at length with our Citrix customers and learned of several shortcomings in the way they implemented shadowing in their more recent product versions. As a result, we made a few tweaks to our Premium Management Features overlay to make it completely compatible with Citrix environments, as well as RDS and WVD. Here is a list those shortcomings and how our Premium Management Features product overcomes it.
Citrix Shadowing Depends On Remote Assistance Being Installed On the Help Desk Technician’s Computer, Among Other Things…
To start shadowing a Citrix session, you log into Citrix Director, find the user’s session, and press “Shadow.” Citrix Director generates a Microsoft Remote Assistance file (invite.msrcincident), which you must load into the Microsoft Remote Assistance client (MSRA.exe) to start shadowing.
You better have the Microsoft Remote Assistance feature installed AND line of sight to your Citrix servers if you want to shadow sessions.
While MSRA.exe is already installed on most client operating systems like Windows 10, it is not installed by default on server operating systems like Server 2012, Server 2016, and Server 2019. If it is not installed already, a help desk technician will simply download a file they can do nothing with until the Microsoft Remote Assistance feature has been installed. On top of that, you better hope that your help desk technician’s PC that is running MSRA.exe has line of sight to the Citrix host with the target session to be shadowed. Otherwise, shadowing will not work, because the Remote Assistance ports are selected dynamically from a range, and there is no facility (unlike with modern STUN/TURN/ICE protocols) to wiggle a way through your firewall to connect to the Citrix server.
Our Premium Management Features solution, on the other hand, has zero dependencies on the Microsoft Remote Assistance client. In the Remote Desktop Commander Client with Premium Management Features enabled, the help desk technician simply selects the user session – or sessions plural, because our software can shadow multiple user sessions at once – and then starts the shadowing process. Nothing else is required – the help desk tech is taken directly into the user session. Watch this video to see how easy it is:
Because of this, our Remote Desktop Commander Client can be published as a seamless application, and help desk technicians can now support end users from ANYWHERE, even if they do not have line of sight access to the Citrix hosts running the user sessions, since our client will be running as an app on your servers in the Citrix environment.
Citrix Shadowing Requires User Consent
Currently, there is no way in Citrix to natively shadow a Citrix user’s session without obtaining consent through Microsoft Remote Assistance first. Citrix’s own KB article spells this out. This is a major problem, as there are numerous use cases where consent before shadowing is not desirable. As an example:
Some highly regulated industries require that user activity be observable at any time by supervisors and managers to ensure compliance.
Other industries require that managers have the ability to review worker activity at any time to ensure customer satisfaction.
Educational institutions may need to have the ability to observe and monitor student activity to ensure compliance with policies or to aid in teaching.
Our Premium Management Features solution, with its new Citrix Management Delegation Wizard, allows administrators to set shadowing policies on Citrix hosts so that consent is not required when shadowing a session, and then specifically control which users/managers have the right to perform a shadowing action. Furthermore, our software’s user interface allows help desk technicians and managers to monitor and observe multiple user sessions at the same time with our special “Mini View Dock.”
Use the Management Delegation Wizard to adjust permissions and shadowing policies on all of your RDS, WVD, or Citrix hosts.
Citrix Shadowing and Management Delegation
Admittedly, Citrix has much better management delegation capabilities when compared with RDS or WVD. Still, there are some challenges. Unless you are a customer at one of the highest licensing tiers, you will probably have to choose a preset delegation level. For shadowing, this would typically be the Help Desk Administrator role. Unfortunately, this role also gives extremely powerful rights to those users, such as being able to terminate processes, place servers in a delivery group into maintenance, and also perform power operations.
The built in Help Desk Administrator role offers a lot of power, perhaps too much power…
Our Premium Management Features solutions simplifies this considerably, allowing you to delegate out specific granular management and shadowing tasks to your users, without making them admins on those hosts or giving them rights that could lead to them accidentally taking a server offline. Common management tasks such as shadowing, logging users off, disconnecting users, and messaging users can be assigned to specific users or groups in Active Directory. Then, they only have the rights to perform those specific tasks as required.
What Are You Waiting For? At Only $99.99 Per Named Admin, Help Desk, or Manager User Per Year, Our Premium Management Features Solution is a Bargain!
Say no more. We’ve got you covered. If you start a monthly subscription to our WVD monitoring and management solutions on or before December 31st, 2020, we’ll give you an extra per-host VM per-month discount.
That means that even in the smallest environments (e.g. only 3 WVD hosts), your costs will only be $7.99 per host VM per month for the Remote Desktop Commander Suite, and $13.99 per host VM per month for the full Complete WVD Monitoring and Management Bundle! And if you have more than a handful of hosts, we offer volume discounts that will make it even more affordable. Note – the pricing above is per host VM per month, not per user!
You simply will not find a better deal in the market in terms of price per features for comprehensive monitoring and management of your WVD infrastructure. And we keep adding more and more WVD specific features to our solutions, month after month.
We’ll get back in touch with you shortly thereafter to verify your needs, find out more about your WVD deployment, and provide pricing. We will also supply you with a coupon code for the discounts mentioned above.
Act now before year end to secure this special offer. We look forward to bringing you on board as yet another satisfied RDPSoft customer.
The latest versions of the Remote Desktop Commander Suite (Version 4.9) and Remote Desktop Canary (Version 2.2) support the full monitoring of Windows Virtual Desktop, whether or not WVD is deployed in Fall 2019 (Classic) Mode, or Spring Update 2020 (ARM / Azure Resource Manager) Mode.
Here are the steps you need to take to deploy our solutions to monitor your Windows Virtual Desktop environment:
Step 1 – Provision a VM inside your WVD tenant or Azure Resource Group to run our software.
You may already have a VM deployed with management and monitoring tools on it, or you may wish to deploy a new one. All of our solutions work perfectly well on Server 2012 R2, Server 2016, Server 2019 or on Windows 10 Enterprise multi-session (EVD). You can always elect to place this VM in its own separate host pool, and then publish it as a desktop to your help desk and admin team so they can connect in and run tools when needed via the Windows Virtual Desktop client.
The key thing to remember is that this VM should be located on the same VNet and joined to the same Active Directory + Azure Active Directory domain as the WVD hosts you will be monitoring.
Step 2 – Install SQL Server Express or Azure SQL to store the WVD monitoring data collected by our solutions.
If you have a very small WVD deployment, with 3 or fewer hosts, you can most likely install SQL Server Express on the VM you created in Step 1 above. The Remote Desktop Commander Suite installer will prompt to do this for you automatically.
If you have a larger WVD deployment, you should leverage an Azure SQL database to store the WVD monitoring data instead. We find the most cost effective way to utilize Azure SQL is to opt for a single database, per-DTU model (as opposed to vCore). Using this approach, Azure SQL database costs for 90% of our customers will run somewhere between $30 and $150 USD per month, depending on the number of WVD hosts they are monitoring. Here’s a step-by-step guide on how to provision Azure SQL for our solutions.
To help defray these infrastructure costs for our WVD customers, we have introduced a special discount of $2 off per WVD host per month for the Remote Desktop Commander Suite, and $3 off per WVD host per month if you opt for our Complete WVD Monitoring and Management Bundle. Even if you only have 3 WVD hosts, your cost would only be $7.99 per host per month for the Remote Desktop Commander Suite, and $13.99 per host per month for our Complete WVD Monitoring and Management Bundle!Click here for the details about this promotion that is valid through the end of this year.
Step 3 – Define a service account in your domain that will monitor your WVD hosts, and make the necessary Windows firewall and registry adjustments on those hosts.
This knowledge base article covers the few adjustments you need to make on your Windows Virtual Desktop hosts to allow them to be monitored correctly, especially if they are running Windows 10 Enterprise multi-session. You may wish to define a GPO in your Active Directory that adjusts these settings for you.
Step 4 – Install the Remote Desktop Commander Suite and Remote Desktop Canary to your VM you created in Step 1, and optionally install the Remote Desktop Commander agents on your WVD hosts.
Install the Remote Desktop Commander Suite on the VM you created in Step 1. Link it to SQL Server Express or Azure SQL, and set its service account. Then, add the WVD hosts via the Remote Desktop Commander Configuration Tool, using the Import From WVD Broker wizard. If you would like to collect rich, detailed information on performance per user session and per application, install the agent service on each WVD host.
Importing WVD hosts into RDPSoft solutions is a snap.
Then, install our Remote Desktop Canary solution on the same VM. Set up a synthetic login test workflow against one of your WVD hosts, then clone that workflow against the rest of your WVD hosts. Now, Remote Desktop Canary can begin to continuously monitor your WVD hosts, verifying their responsiveness all the way through the login sequence into the desktop presentation. In WVD (as compared to RDS), Microsoft now handles the infrastructure roles of the Gateway and Broker, so determining login problems, slow login times, and user profile/black screen issues requires a close eye on the WVD hosts themselves.
Step 5 – Launch your WVD client, connect to the VM you created in Step 1, and marvel at the rich analytics and WVD monitoring tools now available at your fingertips!
Track user productivity in WVDRemote Desktop Canary can perform a routine RDP connectivity check on multiple WVD hosts at once.
Greetings friends and current RDPSoft customers! We’ve just released Version 2.3 of Remote Desktop Canary, our synthetic RDP and WVD monitoring and alerting workhorse. This new version offers:
WVD support. Whether you’re still using WVD classic (e.g. Fall 2019 Mode), or you’ve migrated over to WVD in ARM mode (e.g. the Spring 2020 Update), Remote Desktop Canary now supports WVD.
An enhanced workflow cloning wizard. Now, if you want to test each of your session hosts or WVD hosts “all the way to the desktop” using OCR event detection, our new wizard duplicates your test settings across all of your hosts in one easy step.
We’ve improved our OCR alerting engine, so if specific text you are screening for is not seen within a certain number of seconds, Canary’s email alert will include all of the screenshots during the login sequence. As a result, you will immediately see if the login attempt has stalled while loading user profiles/FSLogix, encountered a black screen, or encountered another issue.
Windows Virtual Desktop Support in Remote Desktop Canary
Set up comprehensive synthetic Windows Virtual Desktop login tests in a matter of minutes with Remote Desktop Canary
Some organizations are starting to look towards migrating to Windows Virtual Desktop in Microsoft Azure as their end user computing platform. As one of the Microsoft’s original WVD partners, RDPSoft is committed to supporting WVD throughout our product line. Most recently, we have now added support for WVD within Remote Desktop Canary.
Whether or not you are still running Windows Virtual Desktop in Fall 2019 (Classic) mode, or have migrated to the new ARM-based WVD model (Spring Update), Remote Desktop Canary supports both versions.
Since WVD now takes care of infrastructure components for you (e.g. brokering sessions on to hosts, providing a gateway that routes incoming connections into your hostpools in Azure, etc), Remote Desktop Canary’s value rests in testing each of your individual WVD hosts to make sure they are responding properly and can serve up a desktop quickly. Remember, issues with user profiles, FSLogix, and other components can turn session hosts sluggish, resulting in slow login times, and these sorts of issues cannot necessarily be deduced by WVD diagnostics information alone.
By building a “direct to server” workflow test against one of your WVD hosts, and then using our new cloning wizard (see below) to replicate that test across all of your different hosts, you can quickly set up an entire testing regime to keep eyes on each host’s responsiveness.
Moreover, with Remote Desktop Canary’s scriptable command line interface, you can schedule routine early morning “sanity checks” to make sure your WVD hosts are now up and online, especially if you have already established scaling automation to shutdown hosts and spin them back up each day as your users start to log back in.
Workflow Cloning Improvements
In initial versions of Remote Desktop Canary, cloning was done one workflow at a time. However, many of our users expressed interest in doing scheduled or routine RDP login testing of ALL of their RDS session hosts and/or WVD hosts individually. In order to make this easy, we have expanded our cloning feature so that you can define a synthetic login test for a single RDS or WVD session host, but then rapidly duplicate that test across many different servers from your Active Directory or WVD hosts in your Azure resource group.
Quickly clone an existing “single host” RDP synthetic login test to many different hosts in your domain or WVD tenant
To perform this type of cloning operation, simply:
Define a workflow synthetic RDP login test against one of your RDS servers or WVD hosts.
Test it to make sure it works exactly the way you want it to.
Select the workflow, and press the “Clone” button.
Use the wizard to select additional terminal servers or WVD hosts from your Active Directory or Azure Resource Group.
Remote Desktop Canary will then replicate your testing settings against all of the selected hosts, creating a new workflow testing entry for each host. That’s all there is to it!
If Canary Cannot Login and Access a Full Remote Desktop Quickly, You’ll Now See What Happened Via a Full Login Sequence Playback
Since the release of Remote Desktop Canary version 2.0, more and more of our users have started using OCR event detection to be notified if it takes too long for a user’s desktop to appear in a Remote Desktop session.
In previous versions of Canary, if specific OCR text was not detected within a certain time period, an email alert would be logged stating this fact. Now, in Version 2.3, we have expanded these email alerts to include all of the periodic screenshots Remote Desktop Canary captured during the login sequence.
Remote Desktop Canary will now show you exactly what the login sequence looked like when a desktop could not be loaded in a timely manner. Was it a black screen? Or a roaming profile/FSLogix problem?
Thanks to this login sequence playback with screenshots, a support desk worker or admin can immediately see the likely cause of the delay when loading a desktop, such as roaming profile problems, FSLogix initialization issues, or the dreaded black screen during login.
The Complete Monitoring and Management Bundle for RDS and WVD
At RDPSoft, we’re constantly seeking ways to deliver more features and more value to our clients, at an unbelievable price point. In furtherance of that goal, we have now released the Complete Monitoring and Management Bundle for RDS and WVD. Starting at only $16.99 per server per month or $185.99 per server per year – with a 3 server purchase minimum and volume discounts available – you gain access to all three of our products, including Remote Desktop Canary!
Version 5.0 of the Remote Desktop Commander Suite introduces a new dashboard and report that tracks terminal server CPU usage by application. Whether you run Remote Desktop Services (RDS), Citrix, or Windows Virtual Desktop, figuring out which programs are taxing processor time the most is only a single click away.
Watch how easy it is to profile Terminal Server CPU usage by application
Using the CPU Use By Application Dashboard To Track CPU Usage by Remote Desktop Services Programs
First, make sure you have deployed the Remote Desktop Commander agent to each of your remote desktop servers, Citrix hosts, or WVD hosts. Once agents have been deployed and are collecting data, go to the Reports and Dashboards menu, and select the CPU Use By Application Dashboard.
Choose the time frame you want to evaluate. Quickly, the Remote Desktop Commander Suite calculates the CPU usage per remote desktop application, and sorts programs by greatest to least usage.
If you want to dive into the user session where the application was running, highlight the process name, and click “Open Selected Session.” That recorded remote desktop services session will then be displayed, and you can see all the activity and performance impact of all processes in that user session.
Using the CPU Use By Application Report To Keep an Eye on Programs That Regularly Tax the CPU on Remote Desktop Session Hosts
From within the CPU Use by Application Dashboard, you can click the small Report (Printer) icon to immediately generate an instant report of what is currently displayed in that dashboard.
OR, you can click “Run Reports” from the Reports and Dashboards Menu, select the Performance reporting category, and then select the Performance (Agent Required) – CPU Use By Application report from the list. Running a report this way allows you to further filter out terminal server CPU usage by things like Remote Desktop Session Host name, user or Active Directory group name, or even process name.
Similarly, in the “Run Reports” menu, you can schedule a daily instance of this report so you can track which programs are impacting CPU resources the most on your WVD, Citrix, or RDS hosts.
Of course, you can also profile memory and CPU usage by terminal server session in the Remote Desktop Commander Suite, and you can find out which applications use the most memory on a regular basis, via other dashboards and reports.
Hello everyone. I’m excited to tell you about a brand new feature we’ve added to Version 5 of our Premium Management Features product, the Client Side Connection Analyzer. Please watch the video below and read on to learn more about it.
Troubleshooting RDP disconnects for your users becomes super easy with our Client Side Connection Analyzer
Troubleshooting RDP Disconnects Is Tricky
If you’ve worked with RDS for a while, you probably know how difficult it is to troubleshoot RDP disconnections and other connection problems. There’s nothing that is logged on the terminal server side that is particularly helpful, other than being able to checking out latency and RDP loss and retransmission rates with our Remote Desktop Commander Suite solution.
Windows Updates Can Break MSTSC.EXE
In many cases though, the problem exists on the client computer side, not the server side. The user’s computer may have a Windows update applied that is interfering with Remote Desktop Services, or conversely they may not YET have a critical update installed. Remember the CredSSP problems a few years back, and how that wreaked havoc on terminal server admins worldwide?
Registry Settings Can Break MSTSC.EXE
Users, or their internal IT staff, may also have set registry values on their end that effect how the Windows Terminal Services Client (MSTSC.exe) works, and unless you know what they’ve done, it will be impossible for you to troubleshoot.
Client Side Event Logs Are the Definitive Source Of RDP Disconnect Reasons
Did you know that buried in Windows event logs on a client computer, there are actual error codes that indicate the problem the client encountered when trying to connect, or when it was prematurely disconnected from a session? They are there, but they are hard to find, and you have to translate their numeric codes to actual messages to make sense of them. It’s tricky to say the least.
If you needed to gather up all of this information from the client yourself to troubleshoot your problem, you could easily spend a whole afternoon buried in an RMM tool, exporting event logs, and then trying make sense of the error codes.
This is why we created the Client Side Connection Analyzer – it takes all of the work out of this process.
Use Our Client Side Connection Analyzer to Figure Out The Reasons Behind RDP Connection Problems
Simply send the user you are helping to a special area of our website, where they can download a lightweight tool that will gather up all of this information. They don’t need to install anything on their PC, and it will run with standard user rights.
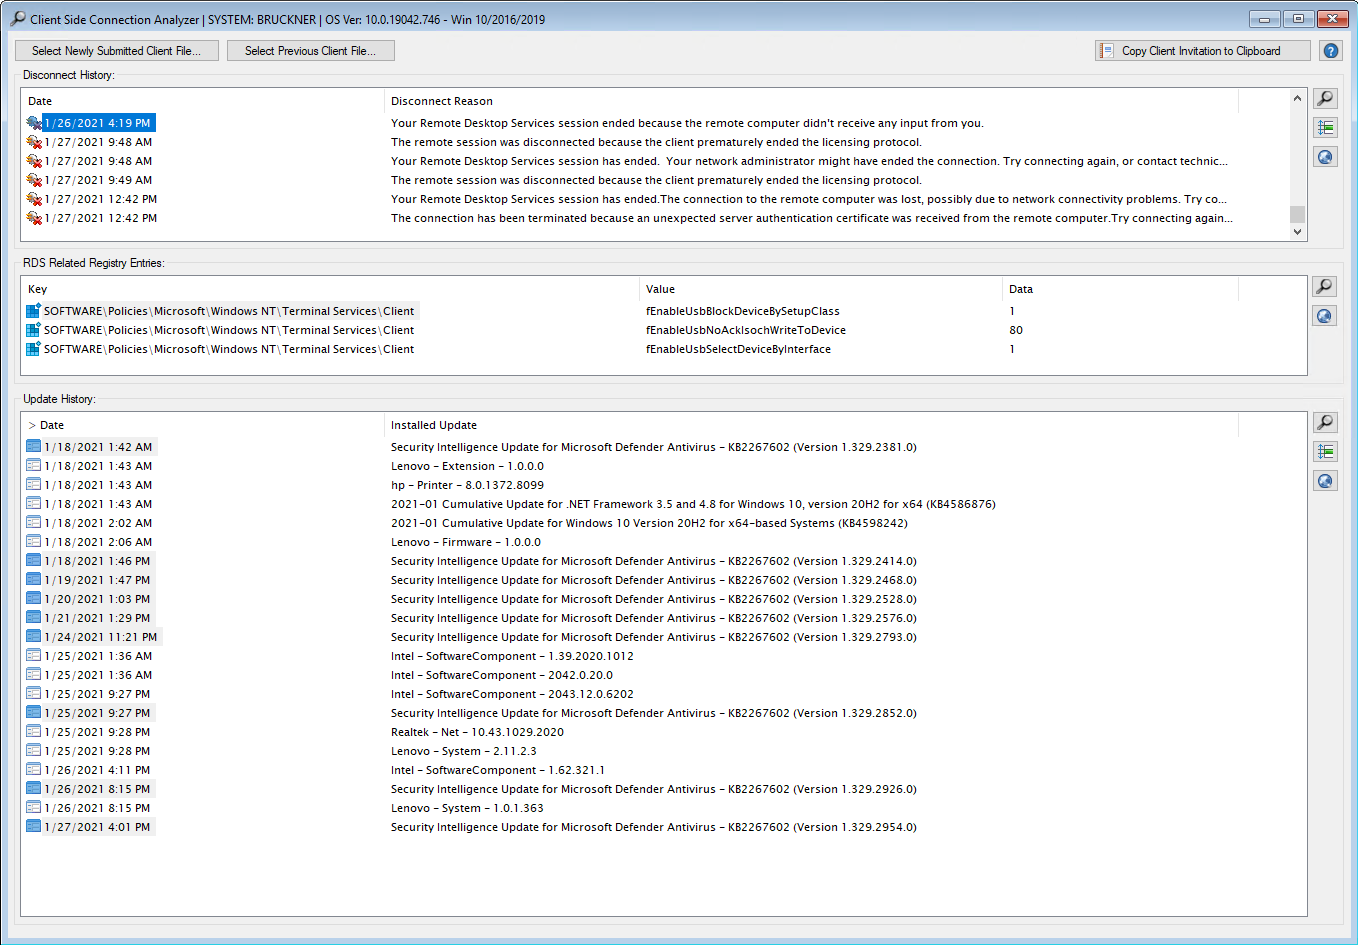
The Client Side Connection Auditor collects all of the information you need from users about RDP disconnects, registry settings, and applied updates, and helps the user send it back to you for troubleshooting.
Once it gathers everything up and stores it in an encrypted file, it will prompt the user to email that file back to you, or to save it and transmit it to you via a different method.
Review and research all relevant information about RDP Disconnects inside the Client Side Connection Analyzer
Once they’ve sent that data file back to you, you can open it up in the Client Side Connection Analyzer and examine everything of importance, such as disconnect reasons, MSTSC related registry keys, and the installed Update History from their PC. You can also see the build and version of Windows displayed in the Title Bar.
You can research any of the RDP disconnect reasons, Terminal Services Client registry keys, or Windows updates online with a single mouse click. Our tool also includes search functionality and the ability to step through all entries one by one.
Start a Subscription For Only $99.99 Per Named Admin and Technician Per Year
Greetings friends and current Remote Desktop Commander customers! We’ve just released Version 5.0 of our Remote Desktop Commander and Premium Management Features solutions. This new version offers something for everyone- whether you use our free Remote Desktop Commander Lite Client, or you have a license for our commercial products. For instance:
The Remote Desktop Commander Suite now comes with a brand new dashboard and report to track CPU usage by application, plus a new Agent Tuning Wizard and Agent Polling Diagnostics report.
Our Premium Management Features overlay now offers the Client Side Connection Analyzer, which makes it very easy to troubleshoot RDP disconnects and other connection problems that your users experience on their Windows PCs.
The Remote Desktop Commander Client now displays, sorts, and groups by user session connection time.
We’re also excited to announce a new promotion that is valid until March 31st, 2021, and to share with you Andy’s very candid take on Windows Virtual Desktop, so please read on!
Quickly Find Out Which Applications Use the Most CPU on Your Terminal Servers
Several of our customers have asked for the ability to quickly find out which programs are using the most memory on their terminal servers, much like we already do with dashboards that profile application memory use.
Version 5.0 now supports this feature. You can either use the new CPU Use By Application Dashboard to review this, or you can run or schedule the CPU Use By Application Report.
For more information on this, including a full demonstration video, please read this recent blog article covering Terminal Server CPU usage and more.
Centrally Optimize Our Agent Service and Run Diagnostics With a Click of a Button
Many of our customers choose to deploy the Remote Desktop Reporter Agent Service on their session hosts to collect additional insights on terminal server performance, or to enhance user activity monitoring. Due to the fact that no RDS or WVD environment is alike, in terms of things like server load, disk space available for SQL Server, etc, it is often necessary to tweak agent service parameters. Such parameters include the rate at which the agent service gathers data, the rate at which the master Remote Desktop Reporter service gathers the agent data, and the type of data collected by the agent.
Previously, this was done manually on individual session hosts by changing registry settings or redeploying the agent with different installer command line parameters.
In Remote Desktop Commander Version 5.0, you can adjust agent polling rates and other agent related settings centrally. Simply make the desired changes in a wizard, then let Remote Desktop Commander contact each session host to adjust the polling parameters and restart the agent service for you.
The Remote Desktop Commander Polling Tuning Wizard quickly reconfigures all agent and master polling parameters to increase/decrease agent service resource use and database storage requirements
Similarly, Version 5.0 now includes an Agent Diagnostics Report, which presents statistics about how agents are performing on your session hosts. For instance, you can view the average number of data points each agent transmits during each polling cycle, how quickly the agent service is gathering that data, and how quickly it is transferring that data to the primary Remote Desktop Reporter service across the network. You can then use the results of this report to fine tune agent polling intervals within the Polling Tuning Wizard mentioned above.
Run the Agent Diagnostics Report to find out how our agent service is performing on each of the session hosts where it is deployed
Figure Out What’s Causing RDP Disconnects and Make Your Users Happy Again!
Ever had a user who just could not stay connected to your Remote Desktop Services deployment? They’ll promptly call up your IT department and offer vague complaints, telling you that their terminal server client (e.g. MSTSC.EXE) is trying to reconnect constantly, their session freezes and then they get kicked out, and on and on.
While previous versions of our Remote Desktop Commander Suite have been able to produce reporting on the latency and quality of the RDP collection for specific users, most of the valuable information regarding disconnects and other RDP connection failures exists on the client’s Windows computer, NOT the terminal servers themselves.
The Client Side Connection Analyzer, part of our Premium Management Features solution, makes it easy to troubleshoot RDP connection problems for specific users.
So, to make your life as an administrator or help desk tech easier, we created the Remote Desktop Connection Analyzer and built it into our Premium Management Features product. You can now send users having issues to our website, to download a lightweight applet which they run with no special user rights required, and no installation required. The applet will quickly gather up and translate all the RDP disconnection reasons, plus relevant registry keys that affect the Terminal Services Client and the Windows update history on their computer. It will then save all of this data to an encrypted file and prompt them to send that file back to you.
From there, you simply load that file into the Client Side Connection Analyzer, and voila! – you have the information you need at your fingertips. You can even do further research on the disconnect reasons via Google with a single click.
For more information on the Client Side Connection Analyzer, including a demonstration video, see this article on RDP disconnects.
Track and Sort By Session Connection Time in the Remote Desktop Session Navigator
Users of our Remote Desktop Commander Suite or our free Remote Desktop Commander Lite tool are very familiar with the Remote Desktop Session Navigator. This is the portion of the Remote Desktop Commander Client that allows you to manage active sessions and processes on RDS, WVD, and Citrix deployments.
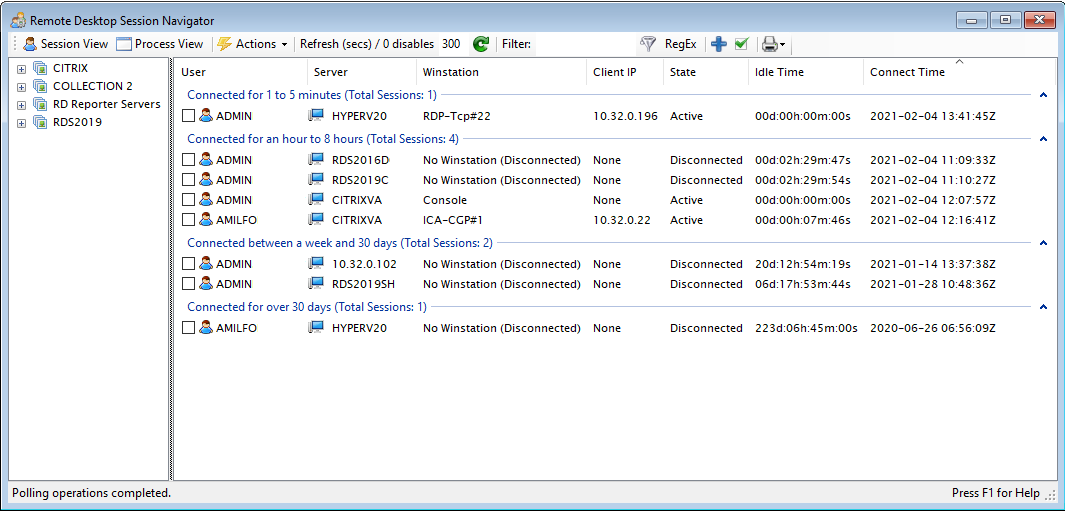
When in Session View, you can sort and group sessions by things like Client Build, Username, Computer, Idle Time, etc. Many of our users have also requested that we include the Session Connection Time, so they can see when the user initially established their session on the server. Also, if you allow users to establish multiple sessions on terminal servers or on the farm in general, this feature comes in handy, as you can identify the oldest of a specific user’s sessions.
Now you can group and sort by session connection time in the Remote Desktop Session Navigator
Note: If you upgrade your existing Remote Desktop Commander Suite or Remote Desktop Commander Lite programs (see below), you may need to make this new column visible first. Simply right mouse click on the column headers in the Remote Desktop Session Navigator, then place a check by the Connect Time column, and it will become visible.
Are You An Existing Customer of One Of Our Tools? Step Up To the Complete Monitoring and Management Bundle With This Special Offer
If you already have a subscription to one or two of our three tools, and would like a quote to step up to the bundle, click here to request a quote from sales, and indicate in the form that you want to step up to the bundle. If you then step up to the complete bundle of products before March 31st, 2020, you will be entitled to a special discount that further reduces your monthly or annual cost for 12 months. You’ll quickly see that for very little extra cost per server, you can get the comprehensive monitoring, reporting, alerting, and management tools you need to run your RDS or WVD environment successfully!
Let’s Get Real About WVD
Yes, we’re an original Microsoft WVD partner, and yes, we anticipate that this technology will grow over time, but it’s very important that you have a true understanding about the pros and cons of WVD before you consider migrating away from Classic RDS.
In the first two articles of his new blog series, our CEO and Microsoft MVP Andy Milford challenges a ton of assumptions about WVD, and questions some of Microsoft’s motives around decisions like:
refusing to make Windows 10 Multisession available outside of Azure,
the inability to use WVD infrastructure components with session hosts located outside of Azure,
the cost of WVD compute and Azure IaaS compute as compared to running RDS on-premises or in a private cloud,
various WVD licensing pitfalls, especially for MSPs and ISVs.
Andy has written the first two blog posts in the series. See:
You have likely noticed that viewing remote desktop sessions and related details has become increasingly difficult. This is largely a result of some recent developments: There was the overhaul of Remote Desktop Services in Windows Server 2012 R2 and later server operating systems. Then, there’s the emergence of Windows Virtual Desktop in Azure.
What about viewing remote desktop sessions in Windows Virtual Desktop? Well, you don’t get much of a break there either. Currently, you must use the Windows Virtual Desktop control plane in the Azure Portal, which is even more feature limited than the Remote Desktop Services Manager in Server Manager for classic RDS deployments.
At RDPSoft, we identified these pain points many years ago, and created an assortment of free and commercial solutions to solve these problems. Here are three different ways we’ve made viewing remote desktop sessions easier:
Viewing Remote Desktop Sessions Properties Such as Idle Time, Connect Time & More
Remote Desktop Commander Lite Helps You View Remote Desktop Sessions Properties
Users of our free Remote Desktop Commander Lite utility can quickly view remote desktop sessions connected to their terminal servers, RDS collections, and WVD hosts, and then perform management actions like logging off disconnected or hung users, sending messages, checking on the quality of their connection, and much more.
Some of the available properties of the displayed remote desktop sessions include:
Username
Server Name
Winstation Name
Client IP
Client Build Number
State (Active/Disconnected)
Idle Time
Connect Time
Session ID
RDP Bandwidth
Viewing Remote Desktop Session User Activities in Real Time With SuperShadow
Viewing Multiple Remote Desktop Sessions At Once With the MiniView Dock
Of course, some organizations need to view what users are actually doing inside their remote desktop sessions in order to assist them in a support session, or to audit their work in accordance with policy. If so, our Premium Management Features solution is a very affordable way to do so, giving admins, help desk workers, and managers the ability to view and remote control remote desktop sessions in RDS and WVD with ease.
Multiple remote desktop sessions can be viewed and/or interacted with at the same time inside the MiniView dock, and specific sessions can be brought into sharper focus with powerful resizing features.
Viewing Remote Desktop Session Activity On a Historic Basis To Analyze Performance & Monitor User Activity
Administrators and Managers Can View Recorded Remote Desktop Session Activity After the Fact With the Remote Desktop Commander Suite
Finally, some businesses need to have full insight into how the remote desktop session activity of various users impacts the performance of their terminal servers. They may also need to record terminal server sessions to satisfy auditing and compliance or security policies on their network. In these scenarios, our Remote Desktop Commander Suite is the best tool for the job.
After administrators deploy a lightweight agent service on each terminal server or WVD host, the main Remote Desktop Reporter Service collects all of this information into a central SQL database, such as CPU and Memory utilization per process and per user session, TCP/UDP network activity per user and per process, and screenshots with window captions for added context. Managers and server admins can then review this activity to spot performance problems and/or any user activity that violates Acceptable Use Policies on corporately owned IT assets.
After a lot of work this Spring, we’re excited to announce that Remote Desktop Canary v3 is almost available! Before its official launch, however, we are seeking beta testers to put it through its paces, as Version 3 represents a major overhaul regarding how Remote Desktop Canary works. Read on to learn why this is, and then follow the link below to sign up to be a beta tester.
Major New Features in Remote Desktop Canary v3
Remote Desktop Canary Now Functions as a Windows Service!
We’ve finally turned Remote Desktop Canary into a Windows service!You define the credentials of a user account under which all Remote Desktop Canary testing sessions will run, and the Remote Desktop Canary Service will make sure that user session is always running and performing tests according to your desired schedule.
One of the major limitations of previous versions of Remote Desktop Canary was that it ran in an interactive user session while doing its testing. This meant that if the server running Remote Desktop Canary rebooted, you’d have to depend on the Remote Desktop Canary Kickstarter to relaunch the user session used for testing on that server.
Fortunately, after a lot of R&D, we found a way for a local Windows service to orchestrate the creation and teardown of a user testing session to run Remote Desktop Canary’s tests. By doing so, we’ve completely eliminated the need for the Remote Desktop Canary Kickstarter applet. More importantly, the service itself will resume testing operations after a system restart for any reason.
*This also means that Remote Desktop Canary can now test RDS/WVD environments that have login banners enabled, and bypass them with synthetic input, without needing the Kickstarter tool enabled or a user session running unlocked on a different VM.*
You Can Now Schedule Different Workflow Tests At Different Times During the Day
Schedule different times of tests, during different parts of the day, and carve out “no testing” times when you need to do updates or restart your infrastructure.
With the creation of the new Remote Desktop Canary Service as mentioned above, Remote Desktop Canary v3 can now schedule specific workflow tests at different times. All you need to do is build the testing routines you need and save them to separate workflow files. Then, you can schedule each workflow file to run during specific times of the day. Remote Desktop Canary will do the rest for you.
For example, you may want to do a sanity check early every morning and have Remote Desktop Canary test all of your RDS session hosts or WVD hosts after your nightly reboot, to make sure they are responding properly and that logins can proceed successfully all the way to a desktop, with no hiccups related to loading group policies or FSLogix / UPDs. Then, you may want Canary to start a recurring test the rest of the day for each of your RDS collections through the connection broker. Finally, since you schedule nightly reboots of your hosts (or shut your WVD hosts down at 1am to save money), you may want to have a period of time each evening when Remote Desktop Canary is not doing any testing at all.
Remote Desktop Canary Can Now Automatically Retrieve Relevant Event Log Information from Session Hosts Having Problems, And Include That Information In Its Automated Alert Emails.
Is a session host taking too long to respond, or is a user’s desktop not loading? Automatic diagnostic event log information from the problem host can now be included in your alerts.
In previous versions of Remote Desktop Canary, you would receive basic alerts if a connection broker or session host was not responding or it was taking to long to log in and reach a desktop. In version 3 of Remote Desktop Canary, you can configure *internal* workflows (e.g. tests running inside your network) to automatically gather errors and warning events from many different Windows event logs that may be diagnostically relevant to the problem at hand.
For instance, if FSLogix is taking a long time to load a user’s profile, if group policies are causing login delays, etc, Remote Desktop Canary will automatically include event log information that was logged around the time of the login problem in the alert email it sends to you. This will give you immediate context as to the true problem, and should shorten the time it takes you to fix the issue.
Ready To Participate In the Beta?
Please follow this link to signup. We anticipate the beta download becoming available during the period of May 7th – 14th. We will email you when it is ready.
WVD Is Not All Its Cracked Up To Be. Staying On Classic RDS May Be The Better Move For Your Organization
Our CEO, Andy Milford, just completed his 4 part blog series at PureRDS on some fundamental issues with WVD, which can lead to cost overruns, less reliable service availability, and many other issues compared to staying on classic Remote Desktop Services. Please click here to become enlightened about all of WVD’s potential gotchas before leaping towards a migration away from RDS.
Greetings everyone. I’m excited to tell you about a brand new feature we’ve added to Version 3 of our Remote Desktop Canary product, which is its ability to perform Remote Desktop Monitoring as a Service (RDMaaS).
We have spent months rearchitecting Remote Desktop Canary to run as a Windows service application, so you can now set it up on a virtual machine (running inside or outside your networks) to monitor RDP, Azure Virtual Desktop, and Remote Desktop Services connectivity and login times on a continual or scheduled basis. If the VM Remote Desktop Canary runs on is restarted – to apply updates or for any other reason – it will now restart its testing processes automatically, in accordance with the schedule you have designed.
Please watch the two videos below – make sure to expand to full screen, and change your YouTube settings to view them in high resolution. Then, read on below to learn even more about these features.
Learn how to configure Remote Desktop Canary’s service with a user account that it can utilize to spin up Remote Desktop Monitoring tests.
Remote Desktop Canary v3 is now a true Remote Desktop Monitoring as a Service solution!
Remote Desktop Canary, With Its New RDP Monitoring as a Service Capability, Is Now a True Set and Forget Monitoring Solution for RDS and AVD
Because Remote Desktop Canary now operates as a service, you can program exactly the types of tests (basic RDP connectivity checks, total login duration checks, etc.) that you want to run against individual Remote Desktop Session Hosts, Azure Virtual Desktop Hosts, or even full RDS collections. Then, you can rest easy knowing that the Remote Desktop Canary service will perform the tests you want around the clock, according to the schedule you have defined.
Even if the Windows Server VM you have installed Remote Desktop Canary on is rebooted due to Windows updates, patching, or other maintenance tasks, Remote Desktop Canary will pick right back up where it left off, based on its testing schedule.
New Scheduling Features Let You Stop Synthetic RDP and Azure Virtual Desktop Login Tests During Maintenance Periods
Many organizations do nightly or weekly reboots of their Remote Desktop Servers to improve reliability and make sure necessary Windows updates are applied. You can easily plan around those timeframes with the Remote Desktop Canary 3.0’s new scheduling engine.
Similarly, if you run Azure Virtual Desktop, you are probably shutting some of your AVD hosts down at non-peak times to save money. You can now have Remote Desktop Canary stop monitoring certain hosts in the evening, and then resume monitoring in the morning.
Even more importantly, you can now schedule a separate “sanity check” test to make sure all of your AVD hosts or RDS session hosts are fully responding and providing desktops each morning – which is critically important if you leverage FSLogix, or other user profile management solutions, that could fail to load if Azure Files or other required Azure services are offline. We’ve even heard of the Azure Virtual Machines themselves not loading properly after a cold start in the morning, but Remote Desktop Canary will sound the alarm if any of them are unresponsive, alerting you to the issue ahead of time, allowing you to fix an issue before the morning login storm of users.
Learn More About Remote Desktop Canary’s Features, Pricing, and How to Start a Monthly or Annual Subscription


 . We’ll be starting our beta testing program soon, so we’d love for you to sign up below to participate.